

- Spread
- ORL -2.5
- Total
- O 234.50
- Moneyline lean
- N/A
- Model picks
- Pending
Current odds
Updated hourly. Check the sportsbook for the latest. FanDuel
| Team | Spread | Total | ML |
|---|---|---|---|
| ATL | +2.50 -115 | O O 234.50 -106 | +114 |
| ORL | -2.50 -105 | U U 234.50 -114 | -134 |
 DraftKings
| Team | Spread | Total | ML |
|---|---|---|---|
| ATL | +2.50 -112 | O O 234.50 -108 | +110 |
| ORL | -2.50 -108 | U U 234.50 -112 | -130 |
Model picks
Model picks for this game aren't posted yet. They appear after the morning run.
ATL model accuracy
| Scenario | W | L | Hit rate |
|---|---|---|---|
| Overall | - | - | N/A |
| Away games | - | - | N/A |
| As fav / dog | - | - | N/A |
| Combined scenario | - | - | N/A |
ORL model accuracy
| Scenario | W | L | Hit rate |
|---|---|---|---|
| Overall | - | - | N/A |
| Home games | - | - | N/A |
| As fav / dog | - | - | N/A |
| Combined scenario | - | - | N/A |
Last 10 games
ATL last 10
| Date | Game | Result |
|---|---|---|
| – | – | – |
| 04/28 | – | – |
| – | – | – |
| – | – | – |
| – | – | – |
| – | – | – |
| – | – | – |
| – | – | – |
| – | – | – |
| – | – | – |
ORL last 10
| Date | Game | Result |
|---|---|---|
| – | – | – |
| 05/01 | – | – |
| – | – | – |
| – | – | – |
| – | – | – |
| – | – | – |
| – | – | – |
| – | – | – |
| – | – | – |
| – | – | – |
Team Injuries
Atlanta Hawks Injuries

Status: Day-to-day
Date: 2026-03-30
Landale (illness) is questionable for Monday's game against Boston.
Orlando Magic Injuries

Status: Out
Date: 2026-03-30
Black (abdomen) has been ruled out for Tuesday's game against Phoenix.
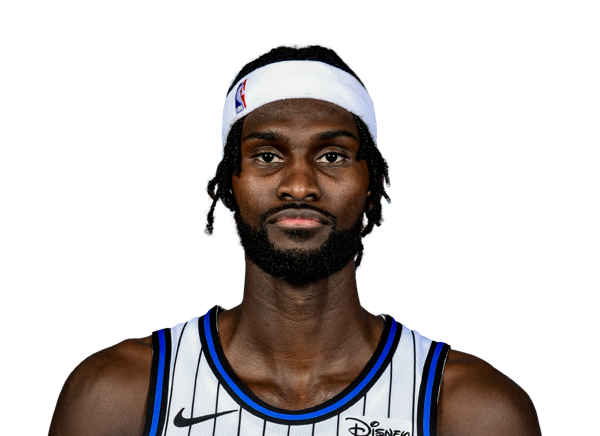
Status: Out
Date: 2026-03-30
Isaac is out for Tuesday's game against the Suns due to a sprained left knee.
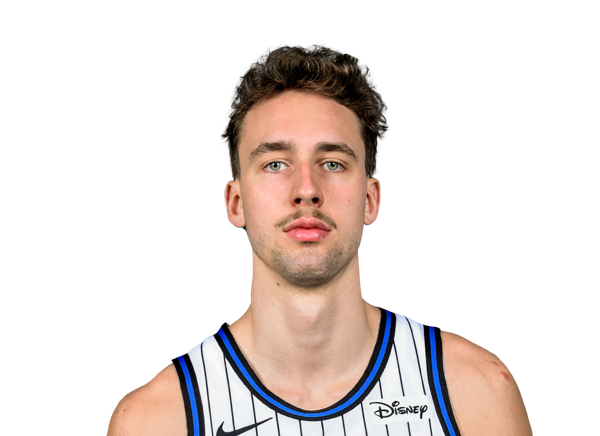
Status: Out
Date: 2026-03-30
Wagner (ankle) has been ruled out for Tuesday's game against the Suns.
Season averages
Atlanta Hawks Averages
| Stat | Average | Away Average |
|---|---|---|
| Field Goal Attempts | 90.0 | 90.0 |
| Field Goals Made | 44.0 | 44.0 |
| Three-Point Attempts | 36.0 | 36.0 |
| Three-Point Made | 14.0 | 14.0 |
| Free Throw Attempts | 36.0 | 36.0 |
| Free Throws Made | 30.0 | 30.0 |
| Offensive Rebounds | 11.0 | 11.0 |
| Defensive Rebounds | 31.0 | 31.0 |
| Assists | 28.0 | 28.0 |
| Steals | 9.0 | 9.0 |
| Blocks | 3.0 | 3.0 |
| Turnovers | 17.0 | 17.0 |
| Personal Fouls | 30.0 | 30.0 |
| Points | 132.0 | 132.0 |
Orlando Magic Averages
| Stat | Average | Home Average |
|---|---|---|
| Field Goal Attempts | 85.0 | 85.0 |
| Field Goals Made | 41.0 | 41.0 |
| Three-Point Attempts | 40.0 | 40.0 |
| Three-Point Made | 13.0 | 13.0 |
| Free Throw Attempts | 39.0 | 39.0 |
| Free Throws Made | 30.0 | 30.0 |
| Offensive Rebounds | 9.0 | 9.0 |
| Defensive Rebounds | 30.0 | 30.0 |
| Assists | 30.0 | 30.0 |
| Steals | 10.0 | 10.0 |
| Blocks | 3.0 | 3.0 |
| Turnovers | 20.0 | 20.0 |
| Personal Fouls | 28.0 | 28.0 |
| Points | 125.0 | 125.0 |
Recent form
Rolling averages over the last 3, 5 and 10 gamesField Goal Percentage (FG%)
| Team | Last 10 Games | Last 5 Games | Last 3 Games |
|---|---|---|---|
| FG% | 49.0% | 48.0% | |
| ATL FG% | 49.0% | 49.0% | 49.0% |
| ORL FG% | 48.0% | 48.0% | 48.0% |
Three-Point Percentage (3P%)
| Team | Last 10 Games | Last 5 Games | Last 3 Games |
|---|---|---|---|
| 3P% | 39.0% | 32.0% | |
| ATL 3P% | 39.0% | 39.0% | 39.0% |
| ORL 3P% | 32.0% | 32.0% | 32.0% |
Free Throw Percentage (FT%)
| Team | Last 10 Games | Last 5 Games | Last 3 Games |
|---|---|---|---|
| FT% | 83.0% | 77.0% | |
| ATL FT% | 83.0% | 83.0% | 83.0% |
| ORL FT% | 77.0% | 77.0% | 77.0% |
Points
| Team | Last 10 Games | Last 5 Games | Last 3 Games |
|---|---|---|---|
| ATL Points | 132.0 | 132.0 | 132.0 |
| ORL Points | 125.0 | 125.0 | 125.0 |
Quarterly Points and Points in Paint Comparison
| Team | 1st Q | 2nd Q | 3rd Q | 4th Q | PIP |
|---|---|---|---|---|---|
| ATL | 29.2 | 30.3 | 29.2 | 28.5 | 55.1 |
| ORL | 27.1 | 25.9 | 25.7 | 26.1 | 45.5 |
Team Performance Breakdown

Away

Home
Detailed Stats
Field Goals Attempted (FGA)
Field Goals Made (FGM)
Three-Point Attempts (TPA)
Three-Point Made (TPM)
Free Throws Attempted (FTA)
Free Throws Made (FTM)
Field Goal Percentage (FGP)
Three-Point Percentage (TPP)
Free Throw Percentage (FTP)
Offensive Rebounds (ORR)
Defensive Rebounds (DER)
Assists (AST)
Steals (STL)
Blocks (BLK)
Turnovers (TOO)
Personal Fouls (PF)
Points (PTS)
Projected Lineups
Atlanta Hawks




Orlando Magic



Race to Milestones
Race to 10 Points
| Quarter | ATL | Win % | VS | ORL | Win % |
|---|---|---|---|---|---|
| Q1 | 0/0 | 0% | • | / | % |
| Q2 | / | % | • | / | % |
| Q3 | / | % | • | / | % |
| Q4 | / | % | • | / | % |
Race to 15 Points
| Quarter | ATL | Win % | VS | ORL | Win % |
|---|---|---|---|---|---|
| Q1 | / | % | • | / | % |
| Q2 | / | % | • | / | % |
| Q3 | / | % | • | / | % |
| Q4 | / | % | • | / | % |
Head-to-Head Race To Snapshot
| Qtr | ATL First | ORL First | ATL % | ORL % | Games | Edge |
|---|---|---|---|---|---|---|
| Q1 | 2 | 3 | 40.0% | 60.0% | 5 | Home |
| Q2 | 2 | 3 | 40.0% | 60.0% | 5 | Home |
| Q3 | 4 | 1 | 80.0% | 20.0% | 5 | Away |
| Q4 | 3 | 2 | 60.0% | 40.0% | 5 | Away |
| Qtr | ATL First | ORL First | ATL % | ORL % | Games | Edge |
|---|---|---|---|---|---|---|
| Q1 | 2 | 3 | 40.0% | 60.0% | 5 | Home |
| Q2 | 1 | 4 | 20.0% | 80.0% | 5 | Home |
| Q3 | 4 | 1 | 80.0% | 20.0% | 5 | Away |
| Q4 | 4 | 1 | 80.0% | 20.0% | 5 | Away |
Recent Matchups (Race to 10)
| Date | Home | Away | Q1 | Q2 | Q3 | Q4 |
|---|---|---|---|---|---|---|
| 2025-02-10 | Magic | Hawks | Magic | Hawks | Hawks | Magic |
| 2025-02-20 | Hawks | Magic | Hawks | Magic | Magic | Hawks |
| 2025-04-08 | Magic | Hawks | Magic | Magic | Hawks | Hawks |
| 2025-04-13 | Hawks | Magic | Hawks | Magic | Hawks | Hawks |
| 2025-04-15 | Magic | Hawks | Magic | Hawks | Hawks | Magic |
Quarter and Halftime Leaders (League Snapshot)
| Team | GP | Lead | % Lead | Avg Q MOV | Wins When Lead | Avg Final MOV |
|---|---|---|---|---|---|---|
| No data. | ||||||
| Team | GP | Lead | % Lead | Avg Q MOV | Wins When Lead | Avg Final MOV |
|---|---|---|---|---|---|---|
| No data. | ||||||
| Team | GP | Lead | % Lead | Avg Q MOV | Wins When Lead | Avg Final MOV |
|---|---|---|---|---|---|---|
| No data. | ||||||
| Team | GP | Lead | % Lead | Avg Q MOV | Wins When Lead | Avg Final MOV |
|---|---|---|---|---|---|---|
| No data. | ||||||
| Team | GP | Lead | % Lead | Avg HT MOV | Wins When Lead | Avg Final MOV |
|---|---|---|---|---|---|---|
| No data. | ||||||